How to Calculate Solar Savings for Your NSW Home
Figuring out your potential solar savings isn't about guesswork. It all comes down to comparing what you pay for power now with what you’ll save by generating your own.
This means digging into your energy bills, estimating what a new solar system can produce on your roof, and working out the real dollar value of that power. Let's walk through how it's done.
The Real-World Value of Solar in NSW
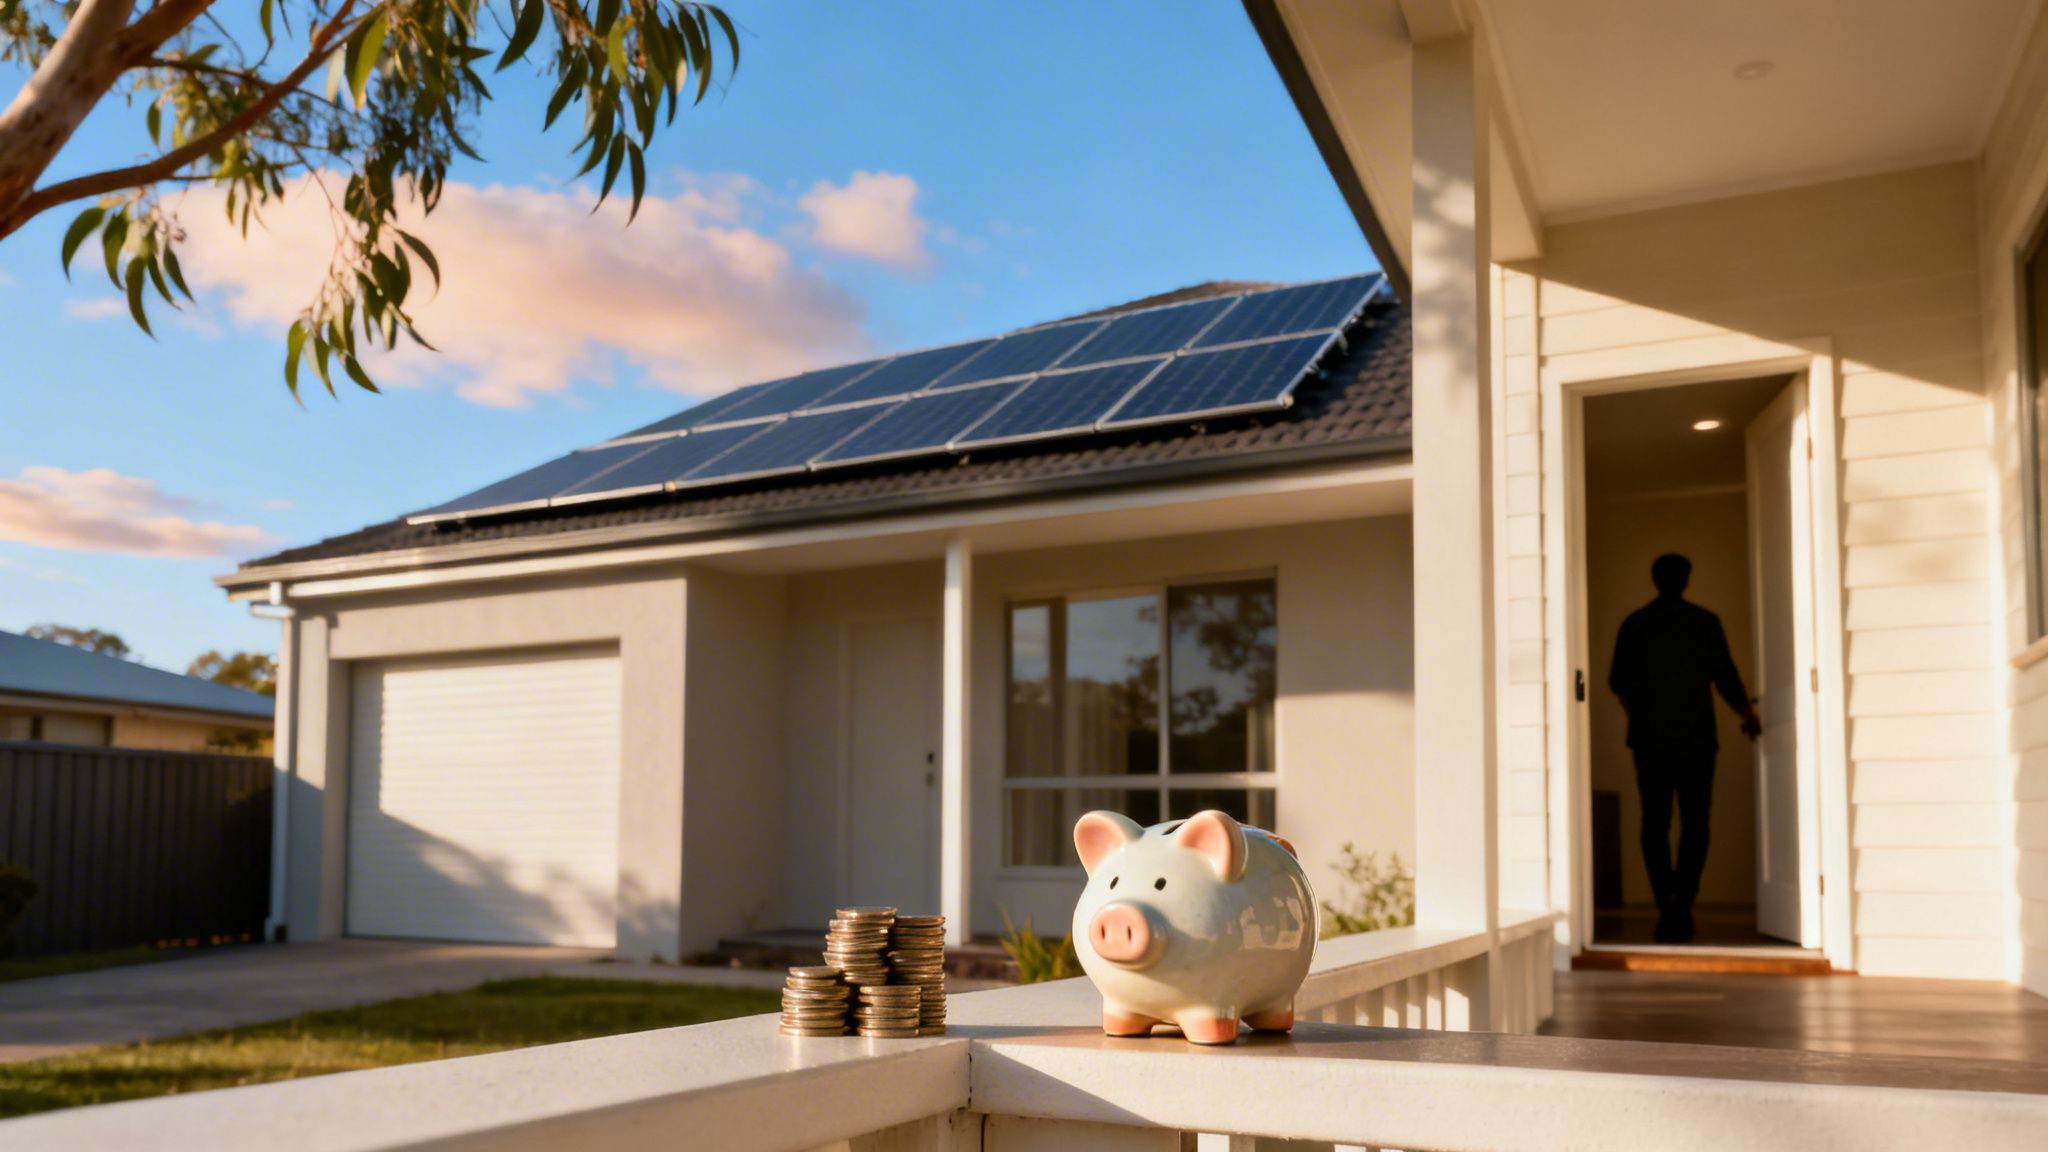
Before we jump into the numbers, it’s important to understand what a high-quality solar energy solution really means for homeowners across New South Wales. This is about more than just shaving a few dollars off your quarterly bill; it's about taking back control from the energy companies.
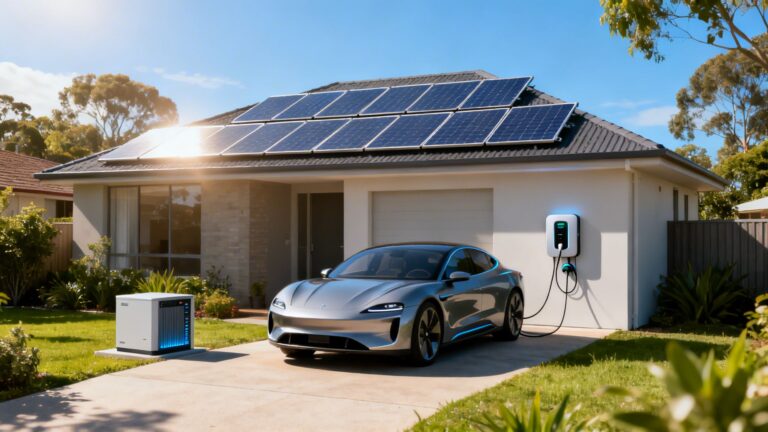
With electricity prices always seeming to head in one direction, securing independence from the grid has never been more important. Solar panels, especially when paired with a solar battery or EV charger, give you a clear path to doing just that, turning your roof into an asset that actively cuts your household costs.
A Solar Powerhouse in Australia
There’s a good reason New South Wales leads the country in rooftop solar. Plenty of sunshine and smart policies have created the perfect conditions for homeowners to see a fantastic return on their investment in solar panels.
Many of our customers in Sydney are slashing their electricity bills by significant margins. That’s a game-changer.
The state now has a massive installed capacity of rooftop solar, making it a true solar leader. For a typical home, a quality solar PV system can deliver substantial annual savings, showing just how effective rooftop solar is right now.
A well-designed solar PV system is your best defence against rising power bills. It's one of the most practical steps you can take to prepare for inevitable electricity price hikes and secure your home's financial future.
To get a clear picture of your own savings, you’ll need to pull together a few key details. These are the essential inputs for any accurate solar calculation.
Your Solar Savings Calculation Checklist
To get started, you'll need to gather a few key pieces of information. This checklist breaks down what you need and where to find it, making the first step of your solar journey as simple as possible.
| Data Point | What It Is | Where to Find It |
|---|---|---|
| Energy Consumption (kWh) | How much electricity you use, usually measured daily or quarterly. | Your recent electricity bills. |
| Electricity Tariffs | The rate you pay for power from the grid ($/kWh). | The "rates" or "charges" section of your electricity bill. |
| Feed-in Tariff (FiT) | The credit you receive for sending surplus solar energy to the grid. | Your electricity provider's website or your latest bill. |
| Roof Details | The orientation, pitch (angle), and any potential shading on your roof. | A quick look at your roof or by using Google Maps. |
With these details in hand, you'll have everything you need to start building a realistic and accurate estimate of what a solar power system can do for your home.
Decoding Your Electricity Bill for Accurate Data
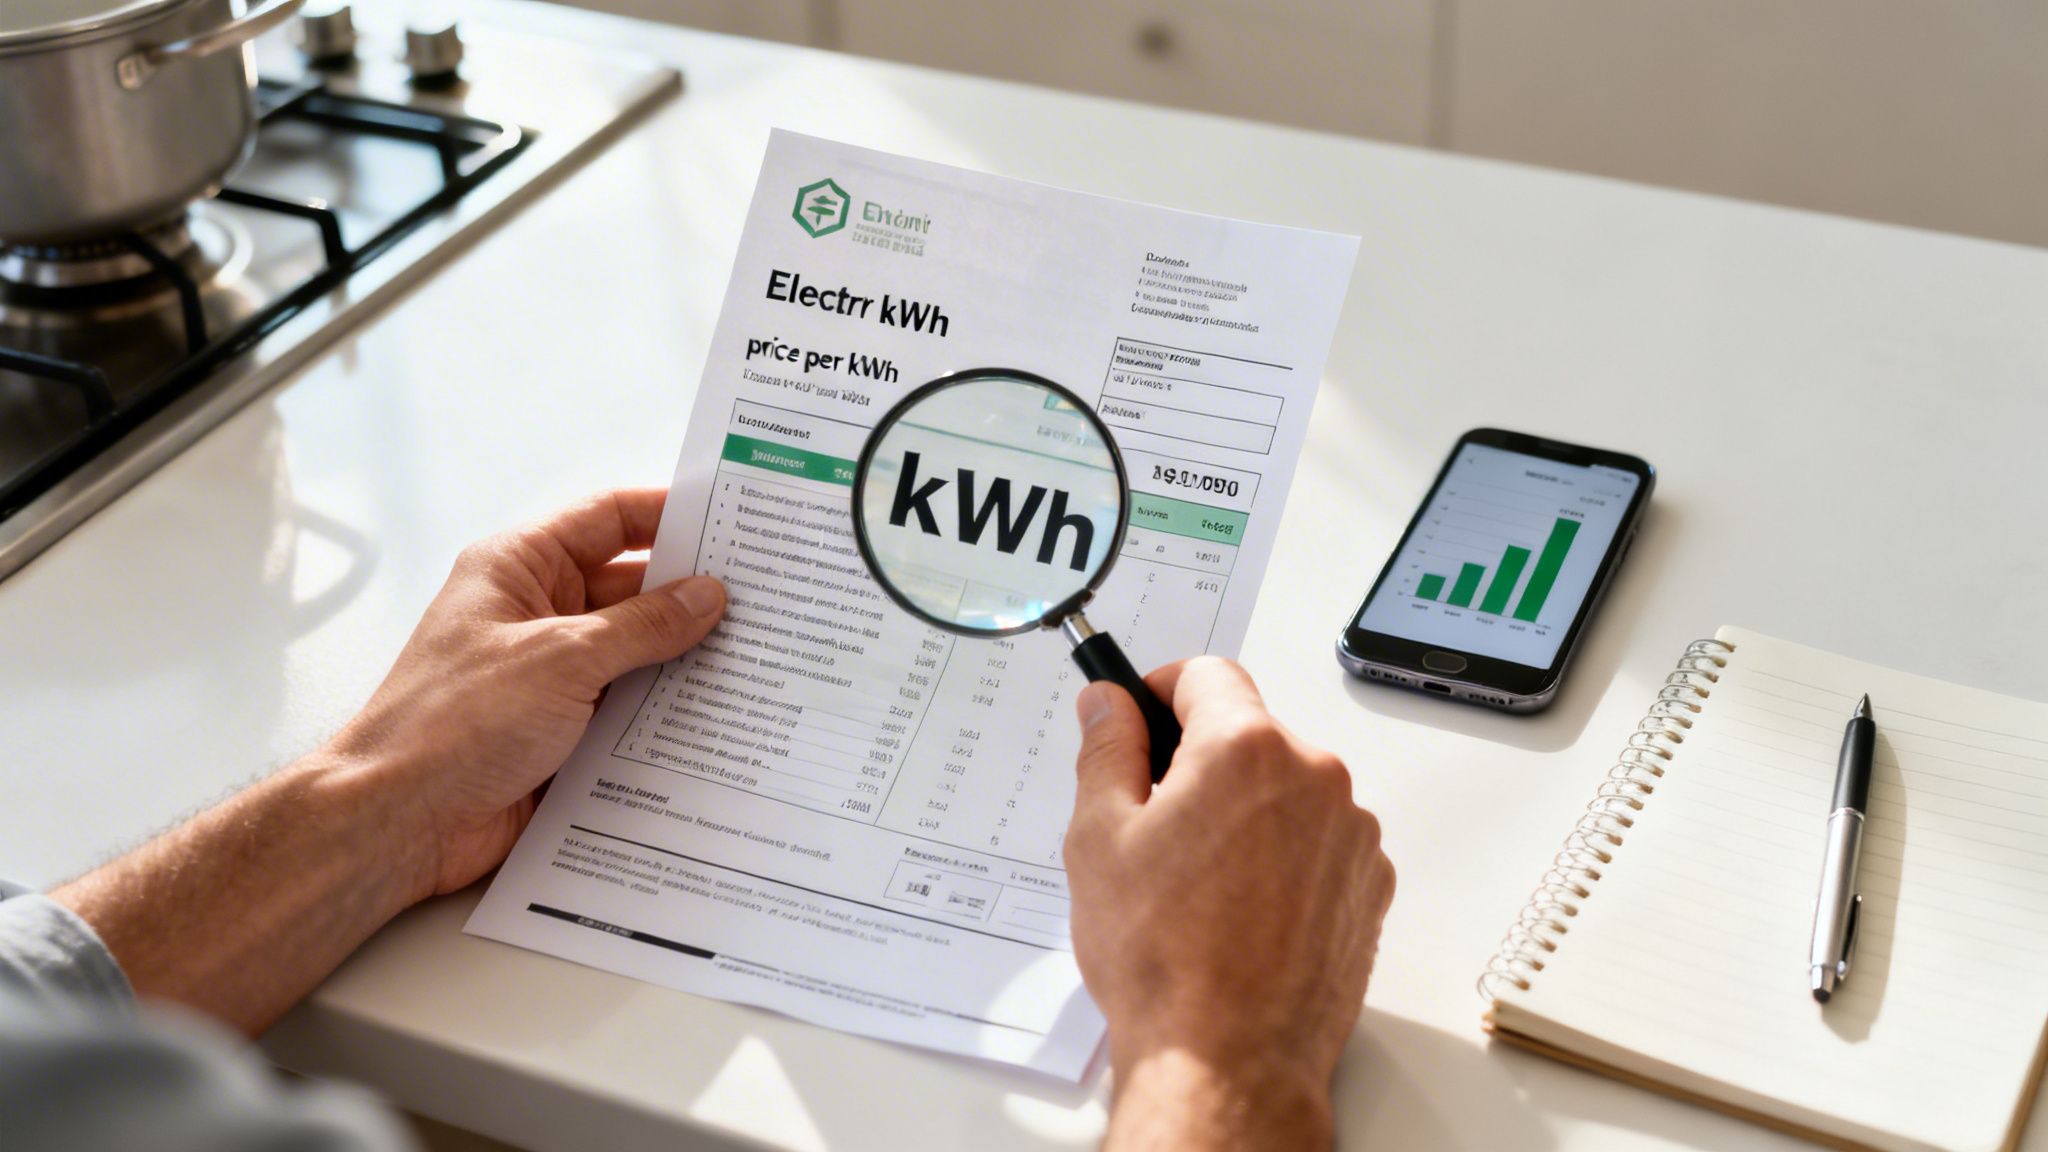
Any serious attempt to calculate solar savings begins with your electricity bill. Forget guesswork—this document holds the hard numbers we need for a proper forecast. It's time to dig out a recent bill and find the figures that will anchor our entire calculation.
The first thing to hunt for is your total energy consumption, measured in kilowatt-hours (kWh). This number shows exactly how much power your home or business pulls from the grid over a billing cycle, which is usually a quarter. Look for a line item called "Total Consumption" or a chart that breaks down your average daily usage.
Finding Your Key Consumption Metrics
Knowing how much electricity you use is one half of the puzzle. The other is figuring out what you actually pay for it. Your bill breaks down your electricity tariff, which is the rate your retailer charges per kWh. This is rarely just a single, flat number.
Most NSW households are now on time-of-use tariffs, meaning the price of electricity changes depending on the time of day. Your bill will show this split into a few distinct blocks:
- Peak: The most expensive period, typically late afternoon into the evening when grid demand is at its highest.
- Shoulder: A mid-range rate that bridges the gap between peak and off-peak times.
- Off-Peak: The cheapest rate, usually overnight and across the weekend.
Nailing down these specific rates is absolutely critical. The savings you generate from your own solar power are directly linked to the grid price you’re avoiding. Using solar to offset peak-hour consumption is where you'll see the biggest financial wins.
Your bill doesn't just show historical usage; it reveals your lifestyle's energy footprint. A high peak usage suggests that shifting consumption or adding a solar battery could dramatically increase your solar savings.
Analysing Your Usage Patterns
With your consumption and tariff data in hand, the final piece is to look at your usage patterns over time. Most bills include a graph showing your average daily use across the past year, and this visual is incredibly valuable.
Does your usage skyrocket in summer to run the air conditioning? Or do you chew through most of your power in the evenings, long after the sun has set? Answering these questions is the key to sizing a solar system that actually fits your life.
For instance, a household running a home office or a pool pump during the day will get massive value from a solar panel system right away through self-consumption. On the other hand, a home with high evening demand is a prime candidate for a solar battery, allowing them to store all that free daytime energy for later. This analysis makes sure your savings forecast is based on reality, not just wishful thinking.
Alright, you've got a handle on your energy usage. The next piece of the puzzle is figuring out how much power a solar system could actually pump out on your roof.
This isn’t some dark art or guesswork. It's a calculation based on a few key variables, and getting it right is crucial to properly calculate your solar savings and see what your return on investment might look like.
The most obvious factor is the size of the system, which we measure in kilowatts (kW). A bigger 10kW system will, of course, generate more electricity than a 5kW one. But that's only if everything else is equal—and in the real world, "everything else" is what makes all the difference.
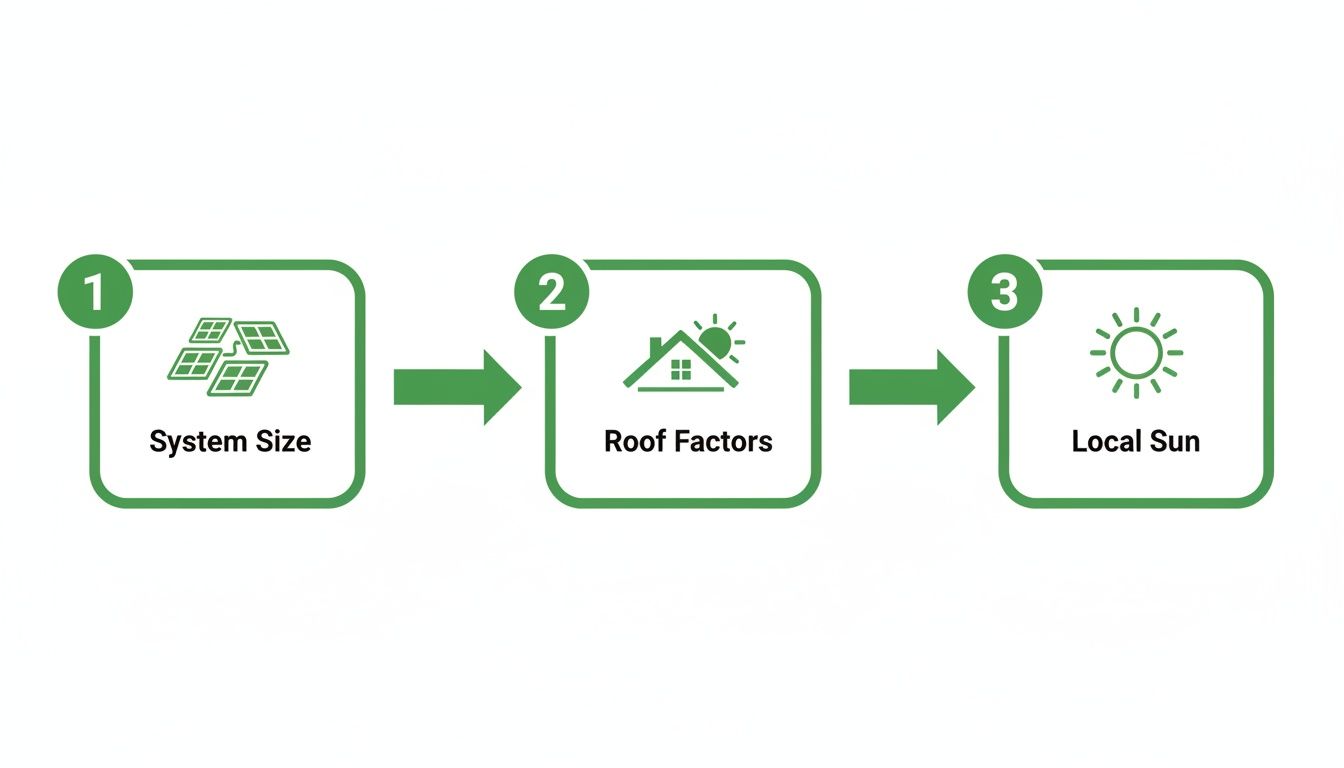
Key Factors That Influence Production
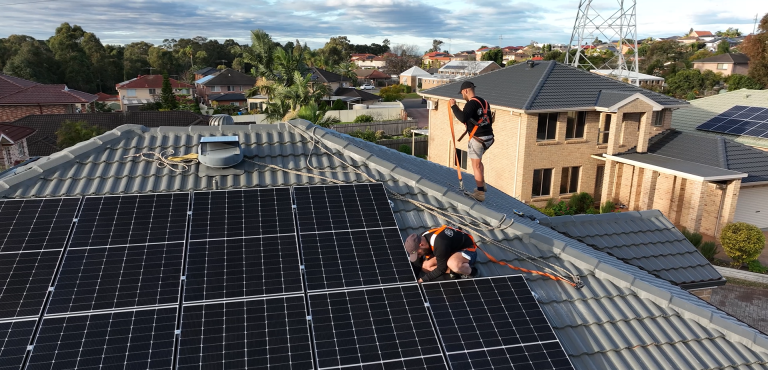
The actual energy your solar panels produce comes down to your home’s specific layout and where you are in NSW. A good installer will do a detailed site assessment, but you can get a pretty solid idea yourself by looking at these factors.
Roof Orientation and Tilt: For us here in Australia, a north-facing roof is the absolute gold standard. It gets the most sun exposure right through the day. East-facing roofs are champs in the morning, while west-facing ones catch all that great late-afternoon sun. The angle of the roof (its tilt) also plays a big part in how directly the sun hits the panels.
Local Solar Irradiance: This is just a technical way of saying how much good-quality sunlight your area gets. Luckily, most of NSW is blessed with plenty of it, making it a fantastic place for solar. A home in sunny Western Sydney will almost always generate more power than one in a coastal spot that gets more cloud cover.
Shading: This is a big one. Any shade from trees, your neighbour’s new extension, or even your own chimney can seriously dent your system's output. Modern panels are better, but even partial shade on a single panel can sometimes drag down the performance of the whole string it's connected to.
You can see why a "one-size-fits-all" quote doesn't really work. A system designed specifically for your roof is the only way to guarantee you're getting the most energy possible, which directly translates to bigger savings.
A Simple Formula for a Production Estimate
Want a quick, back-of-the-envelope number? You can use a simple formula to get a rough idea of your system's daily production. It’s a great baseline for comparing different system sizes.
Daily Energy Production (kWh) = System Size (kW) × Peak Sun Hours
"Peak Sun Hours" is a handy industry term that bundles up all the solar irradiance data for a location into a single daily average. For Sydney and most of NSW, we can conservatively use a figure of around 4.2 hours.
Let’s run the numbers for a standard 6.6kW residential system, which is one of the most common sizes we see.
6.6 kW × 4.2 hours = 27.72 kWh per day
To get your annual production, just multiply that daily figure by 365. This gives you a foundational number we’ll use later to turn kilowatts into real dollars saved. As you dig deeper, you’ll also find there’s real value in enhancing solar efficiency with inverter remote monitoring, which helps you track performance and make sure your system is always running at its best.
Turning Kilowatt-Hours into Dollars: Self-Consumption and Exports
Right, you’ve got a good handle on your home’s energy use and what a solar system could produce on your roof. Now for the exciting part: translating all those kilowatt-hours into real, tangible savings. This is the heart of any solar business case, and it all boils down to two key ways you get value.
The first, and by far the most valuable, is self-consumption. This is the solar power your home uses the moment it’s generated, which means you don't have to buy that same power from the grid. Every single kilowatt-hour you self-consume is a direct saving, knocking money off your bill at your retailer’s full rate.
The Power of Using Your Own Solar
Think about it in practical terms. When the air conditioner kicks on during a sunny afternoon, your solar panels are powering it for free. Without solar, you’d be paying your retailer a premium, especially during those peak hours. This is where a solar panel installation makes its biggest and most immediate impact.
The value is simple: it’s the solar energy you use yourself, multiplied by the electricity price you would have paid otherwise.
For a typical family, daytime energy use can easily make up 30-40% of their total electricity consumption. A solar system essentially makes this chunk of your power usage free from day one, delivering significant savings straight away.
What Happens to Your Surplus Energy
On a bright, sunny day, your system will often generate more power than your home needs at that moment. This excess energy isn’t wasted—it’s automatically sent out to the grid for your neighbours to use.
In exchange for this power, your electricity retailer gives you a credit on your bill for every kilowatt-hour (kWh) you export. This credit is called a Feed-in Tariff (FiT). While the FiT rate is always lower than what you pay to buy electricity, these credits still add up and chip away at your remaining power bill. The rules around FiTs can sometimes feel a bit murky, but understanding the basics of this so-called 'sun tax' is actually quite straightforward. You can read more about that here: https://interactivesolar.com.au/the-so-called-sun-tax-much-ado-about-nothing/
This entire process, from production to savings, hinges on getting a realistic estimate of your system's output.
As you can see, your final production figure—and therefore your savings—is a direct result of the system you choose, the specifics of your roof, and your local climate.
A Worked Example: Putting It All Together
Let's run the numbers for a common scenario: a typical NSW household with a 6.6kW solar system. We'll break down how the savings are calculated step-by-step.
This table shows exactly how the two savings streams combine to create the total annual benefit.
Worked Example Solar Savings Calculation (6.6kW System)
| Calculation Step | Formula / Logic | Example |
|---|---|---|
| Savings from Self-Consumption | Self-Consumed Solar (kWh) × Grid Electricity Rate ($/kWh) | Based on your usage and grid rate. |
| Credits from Exporting | Exported Solar (kWh) × Feed-in Tariff ($/kWh) | Based on surplus power and FiT rate. |
| Total Annual Solar Savings | Self-Consumption Savings + Export Credits | The sum of savings and credits. |
By adding the direct savings from self-consumption to the credits earned from exports, the household achieves its total annual saving.
This simple, two-part calculation is the foundation for understanding the real financial benefit of solar. It's not magic—it's just maths. Once you have these figures, you can confidently see how solar will work for your own home.
Amplifying Your ROI with Batteries and EV Chargers
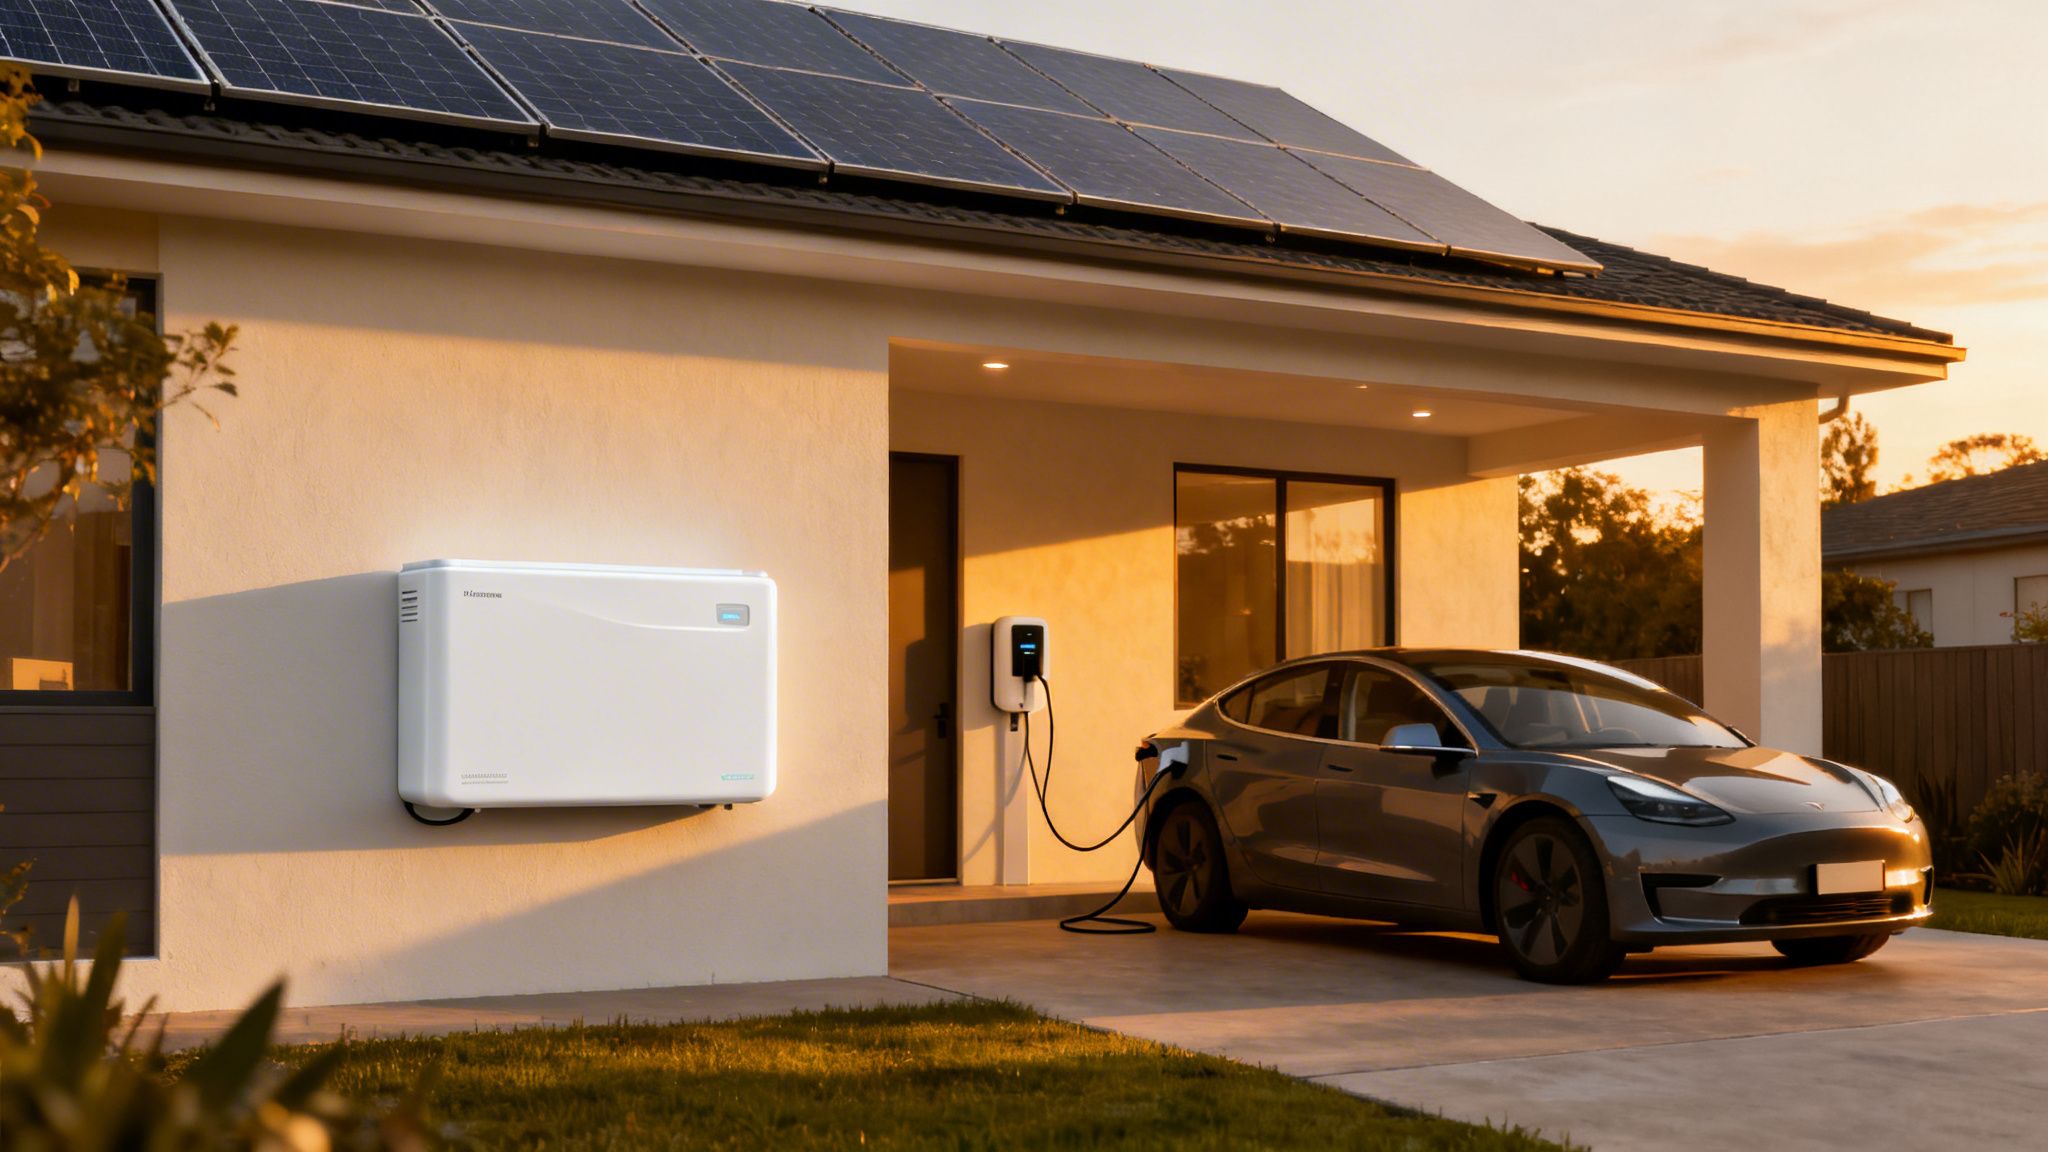
Getting solar panels installed is a massive win, but it’s really just the beginning. If you want to truly squeeze every drop of value from your investment, the next logical move is adding a solar battery or an Electric Vehicle (EV) charger.
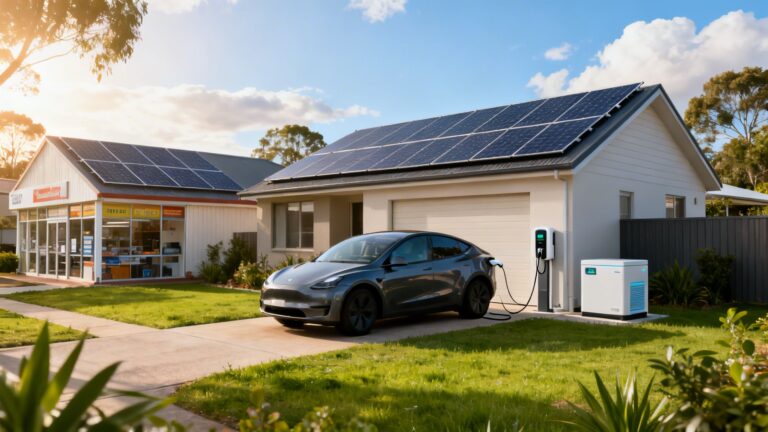
These aren’t just add-ons; they transform your solar panels from a simple power generator into a smart home energy ecosystem. You stop just making power and start controlling it.
Instead of exporting your valuable daytime solar energy back to the grid for a pittance, you can now store it. This means you’re using your own free, clean power during the evening peak when electricity rates are at their most brutal, cutting your reliance on the grid right down.
Boosting Self-Consumption with a Battery
A solar battery completely rewrites the rules of your savings calculation. Without one, a typical household might only use about 30% of the solar energy it generates. The other 70% gets sent back to the grid for a modest feed-in tariff.
But when you add a battery, you can flip that equation on its head. By storing all that excess solar power from the middle of the day, you can push your self-consumption rate to over 80%. Now you’re offsetting the most expensive electricity you would have bought, which has a massive impact on your bill.
And it’s more important than ever. With electricity bills jumping significantly in recent years, taking back control is a huge financial win. For an average system in NSW, pairing a battery with solar panels can dramatically increase your annual savings. It’s no wonder that incentive programs across Australia have led to a rapid increase in battery installations.
Adding an EV Charger to Your Solar Setup
If you own an electric vehicle, the numbers get even better. Sure, charging an EV from the grid is cheaper than filling up with petrol, but charging it with your own solar power is practically free.
It’s like having a private petrol station on your roof.
By integrating an EV charger, you can use your surplus solar energy to power your car, avoiding grid costs and effectively turning sunlight into fuel. An EV owner driving an average amount can save substantially each year just by charging with solar.
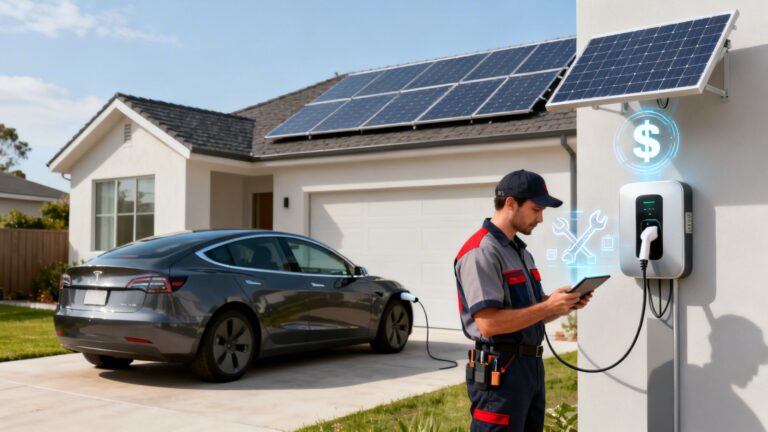
For homeowners with an EV, getting a professional Tesla EV charger installation or a similar setup is a no-brainer. It ensures everything is safe, efficient, and properly integrated with your solar system to maximise those savings.
If you want to dive deeper into what's involved, you might be interested in our guide on electric vehicle charging station installation costs. Factoring in components like solar batteries and EV chargers is how you truly calculate solar savings for a modern, energy-smart home.
Determining Your Payback Period and Long-Term ROI
Think of your solar energy system as more than just an appliance on your roof—it’s a financial asset. Once you have a clear idea of your yearly savings, you can start to map out how quickly that investment will pay for itself and what it will deliver over the long haul.
This really boils down to two key numbers: the payback period and your return on investment (ROI).
Calculating Your Solar Payback Period
The payback period is simply the time it takes for your energy savings to completely cover the initial cost of the system. It’s a great, no-nonsense way to see if the numbers stack up for your home or business.
First, you’ll need the net cost of your system. This is the final price you pay after all government incentives are applied. We can walk you through the latest rebates, and you can also get a good overview of how NSW government rebates for solar slash your upfront costs.
The maths is pretty simple:
Payback Period (in years) = Net System Cost ÷ Total Annual Solar Savings
So, if your system costs a certain amount out-of-pocket after rebates and you're saving a specific amount a year on your power bills, your payback period could be just a few years. From that point on, every dollar saved is pure profit.
For anyone with an investment property, don't forget to factor in tax benefits. Things like claiming depreciation on a rental property can seriously shorten your payback period and boost your long-term returns.
Viewing Solar as a Long-Term Investment
Beyond just breaking even, it’s really powerful to look at your solar system’s annual Return on Investment (ROI). This shifts the conversation from an "expense" to a "performing asset," letting you compare it to other investments like shares or property.
Figuring out the annual ROI is just as easy:
Annual ROI (%) = (Total Annual Solar Savings ÷ Net System Cost) × 100
Using a hypothetical example, saving a significant amount a year on a system gives you an incredible annual ROI. When you look at it that way, you’re not just buying solar panels—you’re making a smart investment that turns your roof into a money-saving powerhouse for years to come.
Answering Your Top Questions About Solar Savings
When you start digging into the numbers on solar savings, a few questions always seem to pop up. It’s completely normal.
Here are the straight answers to the most common queries we hear from homeowners and businesses trying to make sense of it all.
How Accurate Are Those Online Solar Savings Calculators?
Those free online calculators are a decent first step. They’re great for getting a rough idea, but they almost always work off generalised data and averages for your postcode, not your specific situation.
For a forecast you can actually rely on, nothing beats using your own electricity bill, your actual power usage patterns, and the real-world tariff rates you’re paying. That's the only way to get a true picture.
Generic online tools give you a ballpark figure. A professional assessment gives you an investment-grade business case.
Will My Savings Change Over Time?
You can bet on it. Your savings will definitely fluctuate over the years, mainly because electricity prices and the Feed-in Tariff (FiT) rates paid for exported power aren't set in stone.
But here’s the upside: grid electricity prices have a long history of going in one direction—up. As they rise, the solar power you generate and use yourself becomes more valuable every year. This has the powerful effect of speeding up your return on investment and creating a strong buffer against future bill shock.
Do Different Solar Panel Brands Really Affect My Savings?
Absolutely. This is a big one. It’s tempting to think all panels are the same, but the brand and quality have a huge impact on your long-term savings.
Higher-quality, more efficient solar panels will generate more electricity from the exact same amount of sunlight. They also degrade much slower over time. This means they don't just perform better on day one; they produce significantly more energy over their entire 25+ year lifespan.
Choosing premium panels might cost more upfront, but it almost always leads to greater savings and a far more reliable return on your investment compared to cheaper, lower-tier options. This is also true for solar batteries and EV chargers, where quality engineering ensures maximum efficiency and longevity.
Ready to get a precise calculation for your home or business? The team at Interactive Solar provides tailored consultations to design a system with quality solar panels, batteries, and EV chargers that maximises your savings. Take back control of your energy bills by visiting https://interactivesolar.com.au to get your free quote today.